Unitracker

TachoView allows you to view data from your tachograph files. From Driving, Work, Availability and Rest you drivers activity is displayed on a timeline. It also allows you to download or export more detailed reports.

Tachograph files handling is done through DDD files, our app allows for driver activity to be shown on a timeline representing driving, work, availability and rest time intervals with quick historical reference through the calendar.

Driver Activity, Activity Chart and Infringements are all available as reports dependant on the data and content, giving you the perfect insight in to driver performance.

advanced divider

Homepage

There are 3 main components to the main Homepage interface

  • Request Formation Block
  • Driver Activity Chart
  • Blocks of Reports


advanced divider

Settings

You can access the application settings via the cog icon in the right hand side of the header on the homepage.


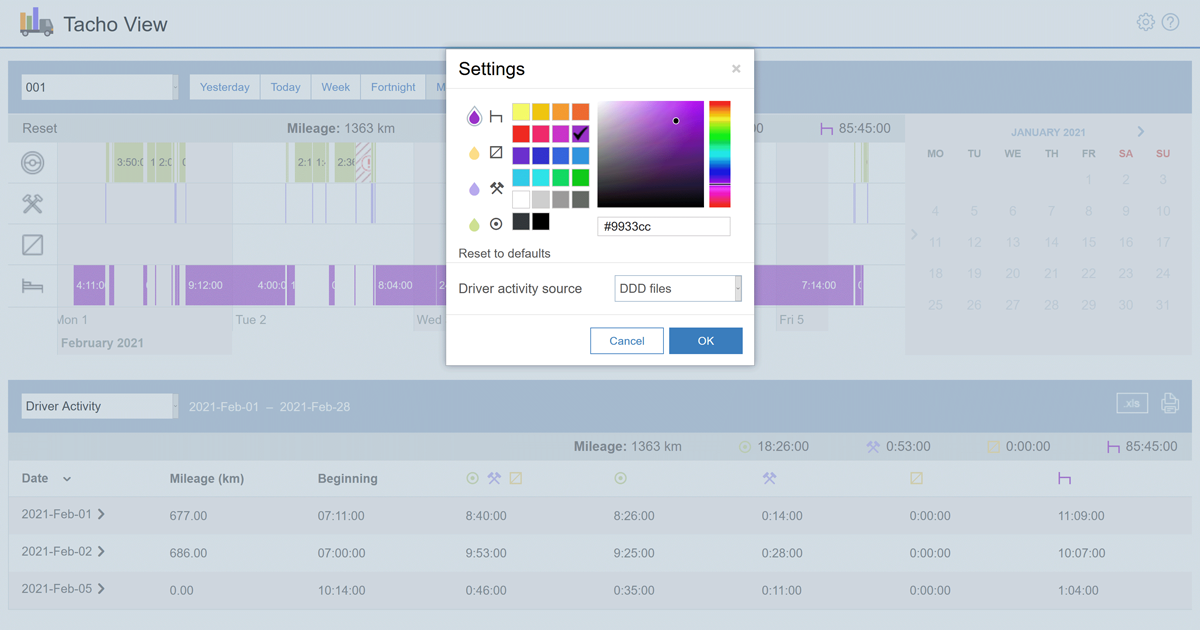
Within this you can change the colour for the driver activity chart and the activity source.

  Rest    Availability    Work    Driving

Driver Activity Source

This allows you to choose where the data comes from, there are two choices.

DDD files – These are received from your tachograph, these can be downloaded automatically or you can choose to do it manually within our Tacho Manager software.

Online Data – This is the information coming through in real time. This is chosen through the unit properties in Unitracker LIVE. When tachograph is chosen the data is continuous, if Bindings is chosen then the data is collectively gathered to report on trips, stops, parking and driver assignments.

advanced divider

Forming a Request

In here you can choose specifics for the data reports such as the specific driver and time interval. There are two types of interval to choose from

Established – Yesterday, Today, Week, Two Weeks, Month

Custom – Indicated from any chosen date range.

advanced divider

Driver Activity Chart

This chart allows you to see the data from your chosen driver and analyse the data and ultimately their behaviour. Colour indicators are displayed on the chart along side graphical elements. If you bring the mouse to any of the elements a tooltip appears showing all information about the chosen activity or violation such as time of incident and duration.

Violations are shown with RED hatching, the start being  marked with an exclamation mark ! with the duration of the timeline marked in red also.

When you zoom in to the chart, the intervals of time you can view or choose from become smaller, decreasing to a minimum of 5 minutes a time allowing you to have a much more precise and detailed analysis of the driver activity.

The legend of activities with total time is indicated on the right of the header.

Clicking the activity date in the calendar allows you to view the chart for that day giving you quick and easy access to all information.


advanced divider

Reports

The bottom section of the homepage is the Report bar, showing the chosen time interval and driver activity legend within the bar header. To create a report select one of the below from the dropdown list.

Driver Activity

This report includes –

  • Date – Activity date
  • Mileage – The distance travelled in 24 hours
  • Beginning – Activity start time
  • Effective Activity – Total duration of driving, work and availability
  • Driving – Duration of driving
  • Work – Duration of work
  • Availability – Duration of availability
  • Rest – Duration of rest

To sort the table contents with any of the above values just click on the chosen parameter. You can also click the date to detail certain events by time – Activity start time, Activity type, Slot duration, Slot status, Driver status and Driver Card.

Infringements

All of the below are included within this table –

  • Time of Infringement
  • Date of Infringement
  • Infringement Type
  • Short Description
  • Severity of Infringement

Activity Chart

This report has a view in which every day of the selected time period is split in to 1 hour intervals. Every activity is shown and the duration of it.

Daily Activity

This report shows an activity for each date with the chosen interval, made with the choice of following parameters –

  • Operating Time
  • Driving Time
  • Mileage
All reports can be downloaded or printed using the icons in the top right hand corner of the Reports header.
advanced divider